Microservices Observability Design Patterns
This is the 8th post in a series on microservices architecture. This article is originally published at https://www.learncsdesign.com

Observability is the superset of monitoring. In addition to providing granular insights into implicit failure modes, it provides a high-level overview of the system’s health. Additionally, an observable system provides ample context about its inner workings, enabling the discovery of deeper, systemic issues.
As soon as a service is deployed in production, we want to know how it is performing in terms of requests per second, resource utilization, etc. Furthermore, we should be alerted if there is a problem, such as a failed instance of a service or a disk running out of space, ideally before it impacts a user. In case of a problem, we need to be able to troubleshoot and do RCA.
As service developers, we should implement several patterns that will make service management and troubleshooting easier. The following patterns can help us design observable services:
- Health check API — Provide an endpoint that returns the health of the service.
- Log aggregation — You can log service activity and store logs in a centralized logging server, which provides alerts and search functionality.
- Distributed tracing — Identify each external request with a unique ID and track requests as they flow between services.
- Exception tracking — Exceptions should be reported to an exception tracking service that de-duplicates exceptions, alerts developers, and tracks how they are resolved.
- Application metrics — Metrics such as counters and gauges are maintained by services and exposed to metrics servers.
- Audit logging — Keeping track of user actions

Health check API Pattern
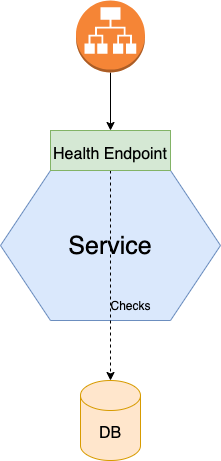
Occasionally, a service may be running but unable to handle requests. A newly started service instance may still be initializing and doing some sanity checks before it can handle requests. It makes no sense for the deployment infrastructure to route HTTP requests to a service instance until it’s ready to process them.
It may also happen that the service instance fails without terminating, for example, all of the DB connections are used up and the database could not be accessed. The deployment infrastructure should not route requests to a service instance that failed and is still running; if the service instance fails to recover, it must be terminated and a new instance created. A service instance must be able to tell the deployment infrastructure whether or not it is able to handle requests. You can use Spring Boot Actuator, which implements a health endpoint, to implement a health check endpoint for your service.

Log Aggregation Pattern
Troubleshooting can be aided by logs. Log files are a good place to start if you want to determine what’s wrong with your application. Logging in a microservices architecture can be challenging since entries are scattered across the log files of different services.
Log aggregation is the solution. Log aggregation pipelines send logs of all service instances to a centralized logging server. When the logs are stored by the logging server, they can be viewed, searched, and analyzed. You can also set up alerts that are triggered when certain messages appear in the logs.
Logging infrastructure is responsible for aggregating logs, storing them, and making them searchable. A number of popular tools provide log aggregation, such as Splunk, Fluentd, ELK stack, Graylog, etc.

Distributed Tracing Pattern
Imagine you are troubleshooting a slow API response. Multiple services may be involved in that API response. Using distributed tracking can provide insight into what your application is doing. A distributed tracer is similar to a performance profiler in a monolithic application. Records information about the service calls that are made when handling a request. You can then see how the services interact during the handling of external requests, as well as how much time is spent on each service.
Each external request is assigned a unique ID and tracked as it flows from one service to another on a centralized server that provides visualization and analysis. Distributed tracing servers include Zipkin, Jaeger, OpenTracing, OpenCensus, New Relic, etc.

Application Metrics Pattern
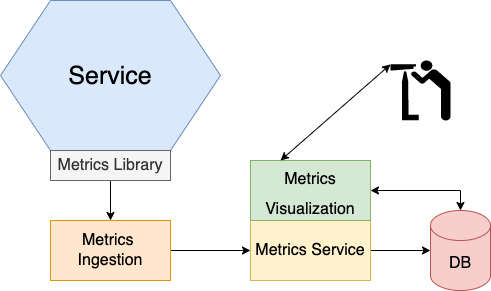
Monitoring and alerting are key components of the production environment. Monitoring systems gather metrics that provide critical information about an application’s health from all parts of its technology stack. The metrics range from infrastructure-level metrics such as CPU, memory, and disk utilization to application-level metrics such as service request latency and a number of requests processed.
Metrics are the responsibility of the service developer in two ways. They must first instrument their service to collect metrics about its behavior. Second, they must expose those service metrics, as well as metrics from the JVM and application framework, to the metric server. The application metrics service can be like the AWS CloudWatch service or Prometheus server which polls endpoints to retrieve metrics. Grafana, a data visualization tool, can be used to view metrics once they are in Prometheus.

Exception Tracking Pattern
When an exception is logged by a service, it’s important to identify the cause. Exceptions indicate a problem or a programming error. Logs are traditionally used to view exceptions. You could even configure the logging server to alert you if an exception is logged in the log file. This has several drawbacks, however:
- Log files consist of single-line log entries, while exceptions have multiple lines.
- In log files, there is no mechanism to track the resolution of exceptions. You would need to manually copy/paste the exception into the issue tracker.
- There’s no way to automatically treat duplicate exceptions as one.
Exception tracking services are a better approach. Services report exceptions to a centralized service, which de-duplicates exceptions, generates alerts, and manages exception management. Exception tracking services like Honeybadger and Sentry are available.

Audit Logging Pattern
Each user’s actions are recorded by audit logging. Typically, audit logs are used to provide customer support, ensure compliance, and detect suspicious activity. An audit log entry records the identity of the user, the action they performed, and the business object involved. The audit log is usually stored in a database table.
Audit logging can be implemented in a few different ways:
- Add audit logging code to the business logic — Each service method can create an audit log entry and save it to the database.
- Aspect-oriented programming (AOP) — You can define advice that intercepts every service method call and persists an audit log entry using an AOP framework, like Spring AOP.
- Utilize event sourcing — Event sourcing by default provides an audit log for creating and updating operations.
By definition, observability patterns are not about logs, metrics, or traces, but about being data-driven during debugging and using the feedback to iterate on and improve the product.
Below are links to posts that explain each pattern in more detail.
1. Monolithic vs Microservices Architecture
2. Microservices Design Principles
3. Microservices Design Patterns
4. Microservices Decomposition Design Patterns
5. Microservices Data Design Patterns
6. Microservices Communication Design Patterns
7. Microservices External API Integration Patterns
8. Microservices Observability Design Patterns
9. Microservices Service Discovery Design Patterns
10. Microservices Cross-Cutting Concerns Design Patterns
11. Microservices Security Design Patterns
12. Microservices Deployment Design Patterns
If you like the post, don’t forget to clap. If you’d like to connect, you can find me on LinkedIn.
